The Official
Journal of
The North
Carolina
Sociological
Association: A
Peer-Reviewed
Refereed Web-Based
Publication
ISSN 1542-6300
Editorial Board:
Editor:
George H. Conklin,
 North Carolina
 Central University

Board:
Bob Davis,
 North Carolina
 Agricultural and
 Technical State
 University

Richard Dixon,
 UNC-Wilmington

Ken Land,
 Duke University

Miles Simpson,
 North Carolina
 Central University

Ron Wimberley,
 N.C. State University

Robert Wortham,
 North Carolina
 Central University
Editorial Assistant

John W.M. Russell,
 Technical
 Consultant
Submission
Guidelines
for
Authors
Cumulative
Searchable
Index
of
Sociation
Today
from
the
Directory
of
Open
Access
Journals
(DOAJ)
Sociation Today
is abstracted in
Sociological Abstracts
and a member
of the EBSCO
Publishing Group
The North
Carolina
Sociological
Association
would like
to thank
North Carolina
Central University
for its
sponsorship of
Sociation
Today
 ®
®
Volume 6, Number 2
Fall 2008
Mortality Patterns in the Southern
Black Belt:
Regional and Racial Disparities*
by
Dale W. Wimberley
Virginia Polytechnic Institute
and State University
Like Appalachia, a governmentally defined region whose existence many Americans take for granted, the officially unrecognized Southern Black Belt is home to many people with an unusually poor quality of life. The Black Belt is a disproportionately rural band of counties following a crescent across the South's coastal plain and up the Mississippi River Delta (Figure 1). Following the term's use over a century ago (Du Bois 1903), researchers typically operationalize the Black Belt as the collective southeastern counties whose populations include higher proportions of African Americans than the national average. But the region's social significance is more than demographic: the Black Belt essentially equals the "Plantation South" and is distinguished by a legacy of extreme structural inequalities.
Figure 1
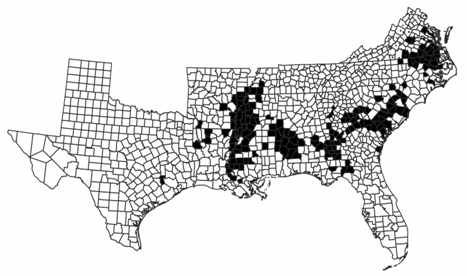
Black shading = Black Counties with Black Population of 40% and over. Other counties (Black Population under 40%) are not shaded.
Previous research shows that, compared to other U.S. regions, the Black Belt has low average family incomes, home ownership rates, and educational attainment; and high poverty and unemployment rates. With the Black Belt excluded, the remaining Southern counties compare quite favorably with the rest of the U.S. on these indicators. Indeed, the Black Belt is in many ways the part of the South that makes the region socioeconomically disadvantaged. Blacks in the Black Belt fare poorly on such indicators compared to Blacks elsewhere in the South, and at least some Black Belt disadvantages apply to Whites (Falk, Talley, and Rankin 1993; Wimberley 2008; Wimberley and Morris 1996; see Tomaskovic-Devey and Roscigno 1996).
Although these earlier studies document the Black Belt's socioeconomic conditions, no researchers have systematically examined mortality patterns essential quality of life indicators for the Southern Black Belt as a whole (see Morris and Wimberley 2002). This study helps fill that gap by compiling vital statistics and census data to calculate and compare the region's infant mortality, life expectancy, and cause of death indicators for 1980, the last census year for which death certificate data are publicly available with sufficient geographic detail to distinguish Black Belt counties from the rest of the U.S.
Much Black Belt scholarship draws a policy conclusion that contradicts recent political currents: alleviating the region's systemic inequities will require federal government intervention (Falk, Talley, and Rankin 1993; Wimberley 2008; Wimberley and Morris 2002). Roosevelt's New Deal, Johnson's War on Poverty, and the Appalachian Regional Commission benefitted poor people and regions; the Black Belt's trans-state character calls for similar regionally-tailored federal intervention (Allen-Smith, Wimberley, and Morris 2000). Even so, national welfare state programs such as those included in the War on Poverty, along with federal enforcement of civil rights legislation spurred partly by intense racial repression in the Black Belt itself, no doubt improved the region's quality of life. However, by the early 1980s conservative forces were besieging and weakening the U.S. welfare state and federal enforcement of civil rights and pro-labor laws. Nationally, occupational and wage structures relatively favorable to U.S. workers deteriorated, and economic inequality grew after a sustained trend toward greater equality (Harrison and Bluestone 1990; Mishel, Bernstein, and Allegretto 2007). All these trends continue to undermine potential solutions for the Black Belt's problems.
Perhaps not coincidentally, the early 1980s also marked a shifting relationship between U.S. mortality trends and inequality. Krieger et al.'s (2008) extensive analysis finds that
- between 1966 and 1980, the relative and absolute socioeconomic disparities in premature mortality and infant deaths shrank, overall and especially among US populations of color; and
- thereafter, starting in 1981 [and continuing to 2002], ... relative and absolute socioeconomic gaps for premature mortality widened, while the relative gap for infant deaths remained unchanged and the absolute difference only marginally lessened (p. 9).
The Black Belt's problems run deep. The region has a long history of extreme wealth and power concentration, coercive class dominance and labor control, and low wages (Billings 1988), conditions originating largely from plantation and tenant agricultural systems. Near the turn of the last century, Du Bois (1903) cataloged the Black Belt's repressive conditions: after slavery ostensibly ended, elite Whites kept Black labor cheap through tenant farming arrangements, debt, fraud, and violence.
Tenant farming gave way to capitalist agriculture, and the Civil Rights Movement virtually ended the worst repression of Blacks, but in the Black Belt a few Whites retained economic dominance while Blacks and many Whites retained a power disadvantage. These conditions tend to suppress Black and White workers' earnings as well as government benefits (e.g., public education, public assistance). The Black Belt's institutional legacy still undermines many inhabitants' quality of life (Ciaramitaro, Hyland, Kovarik, and Timberlake 1988; Reich 1981; Tomaskovic-Devey and Roscigno 1996; Whayne 1996; Wimberley, Thompson, and Wimberley 2007; see also Cohen 2001).
Avoiding early mortality is perhaps the most fundamental aspect of life quality, because other aspects matter little if death intervenes. Existing evidence suggests the Black Belt's health and mortality patterns may parallel the region's documented poor socioeconomic conditions. A large body of research shows that socioeconomic and racial-ethnic disprivilege, inadequate health care, poor health, and early mortality tend to occur together (Klomegah 2008; Lu, Samuels, and Wilson 2004; McLaughlin and Stokes 2002; Oliver and Muntaner 2005; Raphael 2006; Sudano and Baker 2006). The United Health Foundation's (2007) most recent annual rankings identify five Black Belt states Mississippi, Louisiana, Arkansas, Tennessee, and Alabama among the nation's six least healthy states. In 2005 Mississippi was the only state to see a statistically significant increase in its infant mortality rate (Mathews and MacDorman 2008). Research on mortality and health in segments of the Black Belt, e.g., the Delta region or impoverished coastal plain counties of particular states, finds disproportionately high incidence of obesity, diabetes, high blood pressure, strokes, and depression (Davis 2000; Howard, Prineas, Moy, Cushman, Kellum, Temple, Graham, and Howard 2006; Lower Mississippi Delta Nutrition Intervention Research Consortium 2004) alongside disproportionately high mortality (Geronimus, Bound, Waidmann, Colen, and Steffick 2001; Murray, Kulkarni, Michaud, Tomijima, Bulzacchelli, Iandiorio, and Ezzati 2006).
Again, however, no one has systematically analyzed mortality patterns in the Black Belt as a whole or compared those patterns with other regions, and even the piecemeal findings just cited often lack interracial comparisons. This major omission persists primarily because compiling the requisite data is complex and labor-intensive, and because data access is somewhat limited. Though the Census Bureau does not recognize the Black Belt's existence, it routinely provides the kinds of county-level socioeconomic indicators analyzed in previous Black Belt research, making such data analysis relatively straightforward. Detailed county-level mortality indicators, conversely, are rarely disseminated; investigators must compute them after aggregating and merging individuals' death records with several separate data sources. In recent times, government privacy policies have prohibited public release of death records that identify county of residence (except for some urban counties), and have limited scholars' access to such data. Thus, the present study compiles the requisite data and examines the Black Belt's mortality for 1980, the last census year for which the required death records are publicly available. The analysis compares the Black Belt's infant mortality rates, life expectancy, causes of death, and cause-specific "excess" deaths to the rest of the South and to the remainder of the U.S.
Data and Methods
The county-level mortality statistics needed for this analysis were gathered from several National Center for Health Statistics (NCHS) and U.S. Census Bureau digital databases. All parts of the analysis rely on death records identified by county of residence, age, sex, and race. The author compiled these mortality data directly from the complete 1980 U.S. database of approximately two million individual death certificates (NCHS 1985).
Infant mortality rates were defined as the number of deaths of children under one year old per 1,000 live births in 1980. These rates were calculated from (1) the NCHS mortality data and (2) NCHS data for live births by county of residence (NCHS 1991).
Life expectancy calculations required a life table analysis of age-specific death rates (i.e., deaths per 1,000 people in given age groups). These death rates were derived from the NCHS mortality data and Census Bureau county population estimates for July 1, 1980 by age, sex, and race, originally prepared for a National Cancer Institute study (U.S. Census Bureau 1990). Rates were calculated for five-year age intervals (e.g., one interval covered ages 70 through 74) except for three intervals: children less than one year old, children aged one to four years, and adults aged 85 years or more. Life tables a technique originated by comet-discoverer Edmund Halley in the 1600s and long used by life insurance actuaries were estimated from the age-specific death rates by Chiang's method (Namboodiri and Suchindran 1987).
Numerous comparisons of this study's mortality statistics versus published population counts and vital statistics confirmed data processing accuracy. The only discrepancies were life expectancies slightly higher (by 0.1 to 0.5 years, the larger differences being for longer-lived groups) than officially reported statistics (U.S. Census Bureau 1992), due to using "abridged" or multi-year age interval life tables instead of the NCHS' "complete" or single-year interval life tables.
This study relies on many comparisons among geographic units, requiring careful management of geographic data, beginning with operationalization of the Black Belt. Though some analyses have defined the Black Belt to include non-Confederate southeastern states and/or counties with Black populations as low as 12 percent, this study stringently defines the Black Belt: counties in the former Confederacy (Alabama, Arkansas, Florida, Georgia, Louisiana, Mississippi, North Carolina, South Carolina, Tennessee, Texas, and Virginia) whose Black populations were at least 40 percent in the 1980 Census (Figure 1). Independent cities were treated as counties. To combine different agencies data, the author manually matched the dissimilar NCHS and Census Bureau identification codes for the approximately 3,100 U.S. counties and equivalents. The two government agencies sometimes mapped counties differently, complicating but not thwarting the matching process. Of the 61.7 million people (including 12.1 million African Americans and 49.0 million Whites) living in the former Confederate states in 1980, 6.1 million (of which 50 percent were African American) lived in the Black Belt as operationalized here.
Results
Table 1 presents infant mortality rates by region and race. Infant mortality for all races combined is much higher in the Black Belt (18.3) than in either the rest of the South (13.3) or the Non-South (12.1). Thus, with the Black Belt excluded, the South's infant mortality rate closely resembles that of the rest of the United States.
Table 1
Infant Mortality Rates per 1,000 Live Births
|
All |
Black |
White |
Deaths, All |
Deaths, Black |
Deaths, White |
|
|
|
|
|
|
|
|
|
|
|
|
|
|
|
|
|
|
Black Belt |
|
|
|
|
|
|
|
Remain- der |
|
|
|
|
|
|
|
South |
|
|
|
|
|
|
Table 1 shows that the Black Belt's high infant mortality is due more to its proportionately high Black population than to the region i.e., to the Black Belt's collective social, economic, and political history per se. That is, infant mortality rates differ much more between races than among regions. Blacks' infant mortality rates are about double the White rates in each region. In short, forces that produce high infant mortality for Blacks nationally appear to mostly account for the Black Belt's high infant mortality.
Nevertheless, infant mortality rates for both Blacks and Whites are higher in the Black Belt than elsewhere. The "penalty" for both Blacks and Whites living in the Black Belt is an infant mortality rate 7 percent higher than in the Non-Black-Belt South (22.1 versus 20.6 for Blacks, 12.1 versus 11.3 for Whites). If the Black Belt had the same infant mortality rates as the rest of the South in 1980, 137 fewer infants (106 Black and 31 White) would have died there, given the 69,941 Black infants and 41,112 White infants born to the region's residents.
Table 2 shows life expectancy at birth by region, race, and sex. Results generally resemble the infant mortality patterns in Table 1. All-race Black Belt life expectancy is about three years lower than in the rest of the South, which more closely resembles the rest of the U.S. Again, however, African Americans nationally low life expectancy accounts for most of this interregional difference; life expectancy varies much less among regions than between races. For example, female life expectancy differs between the Black-Belt South and the rest of the South by about one year within each racial group, whereas within each region female life expectancy differs between races by 5 to 6 years.
Table 2
Years of Life Expectancy at Birth
|
Females |
Females |
Females |
Males |
Males |
Males |
|
|
|
|
|
|
|
|
|
|
|
|
|
|
|
|
|
|
Belt |
|
|
|
|
|
|
|
Remainder |
|
|
|
|
|
|
|
South |
|
|
|
|
|
|
Nonetheless, such within-race comparisons show both sexes' life expectancy is lower in the Black Belt than in either of the other two regions. Interestingly, the gap in life expectancy between the Black Belt and the Non-Black-Belt South is wider for Whites than for Blacks, and is widest for White males. Compared to White males in the Black Belt, White males in the Non-Black-Belt South can expect to live 1.6 years longer. The cost of residing in the Black Belt is borne by Whites as well as Blacks.
Separate infant mortality and life expectancy analyses for metropolitan and nonmetropolitan counties yield results similar to those reported above (available from the author on request).
Knowing the prevalence of different causes of death in the Black Belt would provide an even deeper understanding of the region's mortality patterns. To find out, the author grouped NCHS detailed causes of death into 43 categories. (For 1980, NCHS classified causes of death by the International Classification of Diseases, 9th revision, then grouped them into 72 categories, and finally combined some of the 72 to form 39 more general categories (NCHS 1983). The present analysis uses these 39 categories, but separates one category major cardiovascular disease into its 5 major types, each of which accounts for a large fraction of deaths. 43 categories [i.e., 38 + 5] result.)
Table 3 lists the top 20 of the 43 categories, ranked by the number of deaths they accounted for among Blacks living in the Black Belt. Taken together, these 20 leading causes of death for Blacks correspond closely to those among the region's Whites; the only exception is stomach and duodenum ulcers, from which 102 Whites died. The top four causes of death among the Black Belt's Blacks are identical to those for all U.S. residents combined (NCHS 1983): heart disease, cancer, stroke, and accidents.
Table 3 provides the basis for calculating the Black Belt's "excess" mortality from each cause the number of Black Belt inhabitants who would not have died in 1980 if that region's mortality patterns matched the Non-Black-Belt South's or the Non-South's patterns. More precisely, excess deaths are those that would not have occurred had the age-, sex-, and cause-specific death rates for a Black Belt racial group equaled the corresponding rates for a comparison group outside the Black Belt. To make such commensurate comparisons, numbers of deaths by race and cause in Table 3 had to be adjusted by "standardized mortality ratios" (details provided on request) (Shryock and Siegel 1976).
Table 4 shows the result. In 1980 the Black Belt had 9,624 (net) excess deaths from all causes combined compared to the rest of the South, and 9,343 excess deaths compared to the Non-South (Table 4, columns 1 and 2). Similar to the infant mortality and life expectancy results above, high death rates among Blacks nationally account for most of these deaths; 6,501 fewer deaths 11 percent of all deaths in the Black Belt in 1980 would have occurred to Blacks in the Black Belt had they experienced the same death rates as the region's Whites (column 3). Still, Blacks in the Black Belt suffered hundreds of excess deaths compared to Blacks elsewhere (columns 4 and 5). Compared to Blacks in the Non-Black-Belt South (column 4), Blacks in the Black Belt experienced many excess deaths from stroke (row 3), accidents (4), and especially heart disease (1), but experienced a "dearth" of deaths (negative excess deaths) from cancer (row 2). Compared to Blacks outside the South (column 5), Blacks in the Black Belt die much more often from strokes (row 3) and accidents (4); slightly more often from heart disease (1); and less frequently from cancer (2), homicide (6), pneumonia and influenza (9), chronic obstructive pulmonary disease (11), and chronic liver disease and cirrhosis (12). Suicide deaths (row 18) are less common among Blacks in the Black Belt vis-à-vis all other groups. Unknown causes (row 5) account for many excess deaths among the Black Belt's Blacks, a point to which we will return. Although these excess deaths may seem numerically slight compared to the U.S.' approximately two million deaths annually, Black Belt Blacks' 836 excess deaths (3 percent of that group's 30,318 deaths) compared to Blacks in the rest of the South are not trivial.
Also striking is the number of excess deaths Black Belt Whites experienced (columns 6 and 7): 3,197 excess deaths compared to the Whites in the Non-Black-Belt South, 10 percent of the region's 31,334 White deaths. Echoing results for life expectancy, Whites pay an even higher mortality price than Blacks for living in the Black Belt. Compared to the rest of the South, more than two-thirds of excess White deaths are due to heart disease (row 1), cancer (2), and strokes (3). A similar but smaller difference exists between Black Belt and Non-South Whites. Deaths from accidents (row 4) are also more prevalent among Whites in the Black Belt than Whites elsewhere.
Conclusion
This article presents the first comprehensive analysis of mortality patterns in the Southern Black Belt, examining infant mortality, life expectancy, leading causes of death, and cause-specific excess deaths based on the most recent publicly-available census-year data. Black Belt residents experienced worse mortality outcomes in 1980 than residents of the Non-Black Belt South and the rest of the U.S., complementing previous research that revealed the Black Belt's socioeconomic disprivilege compared to these other regions. Without the Black Belt's presence, the South's mortality would resemble the rest of the U.S. much more closely. Increasing variation in post-infancy U.S. mortality improvements across socioeconomic levels beginning about 1980 (Krieger et al. 2008), noted earlier, imply some of these interregional disparities may be even more extreme today.
Race, not region per se, accounts for most of the Black Belt's comparatively poor mortality record; the Black Belt's Blacks and Whites differ more from each other than from same-race counterparts elsewhere in the U.S. This finding is unsurprising, given the Black Belt's proportionately large African American population and the huge interracial mortality gap nationally. Closing the persistent mortality gap between African Americans and Whites, if such changes were distributed evenly nationwide, would vastly improve Black Belt mortality.
Nevertheless, residing in the Black Belt exacts a substantial mortality penalty from both Blacks and Whites. Holding race constant, the Black Belt's Blacks and Whites suffered an excess of 4,033 deaths combined (836 + 3,197; see Table 4) in 1980, vis-à-vis the remainder of the South. Surprisingly, the mortality cost of Black Belt residence is greater for Whites than for African Americans. Ten percent of Black Belt Whites' 31,334 deaths that year would not have occurred under the Non-Black Belt South's prevailing mortality rates. This outcome is consistent with the earlier point that the Black Belt's structured inequities disadvantage many Whites as well as Blacks. In a sense, Whites in the Black Belt may have had farther to fall than Blacks, already under relatively extreme mortality conditions nationally.
After factoring in between-race mortality differences, what accounts for the Black Belt's high mortality compared to other regions? Individual-level factors cannot explain differences between regional populations; we must look instead for social structural or cultural explanations. Three such plausible reasons for the Black Belt's mortality patterns include medical care's social context, culturally-rooted behaviors, and socially-induced stress.
First, preventive and curative medical care's availability, use, and quality tend to be lower in impoverished, disproportionately rural regions like the Black Belt. Poor people's ability to pay often limits their access to good medical care. Medicaid partly mitigates this problem, but in 1980 Medicaid covered only 38 percent of Americans below the poverty line (U.S. Census Bureau 1982). Furthermore, health services infrastructure tends to be less extensive in nonmetropolitan areas, and scarcer still where poverty and other deprivations are severe (McLaughlin, Stokes, and Nonoyama 2001). That Black Belt physicians so often list Blacks' causes of death as "unknown" (Table 4) implies that they examined these individuals minimally if at all before death, indicating Blacks in the Black Belt receive less medical attention than Whites in the Black Belt, or than Blacks living elsewhere. Physical distance from providers seems not to account fully for this deficiency, as the "unknown cause" diagnosis is much less common among the region's Whites.
Second, behaviors rooted in potentially distinctive Black Belt subcultural norms, such as poor diets or smoking, may contribute to the region's high mortality. No studies of such behaviors exist for the Black Belt as a whole, though some state-level and other studies are suggestive: eight of the eleven Black Belt states have higher percentages of obese adults than the national median (Bolen, Rhodes, Powell-Griner, Bland, and Holtzman 2000), obesity appears to be more common in the Delta (Lower Mississippi Delta Nutrition Intervention Research Consortium 2004), and Black Belt diets may tend to be high in salt (Smith, Quandt, Arcury, Wetmore, Bell, and Vitolins 2006). The percentage of Whites who smoke cigarettes exceeds the median in ten of eleven Black Belt states (Bolen et al. 2000).
Some such culturally-rooted behaviors may be adaptations to a third explanatory factor: stress, which promotes heart disease and other life-threatening conditions. Individuals tend to experience high stress if they occupy subordinate racial or other positions in a social structure with very unequal power relations (Krieger, Smith, Naishadham, Hartman, and Barbeau 2005). Financial difficulties, unemployment, and taxing working conditions over which the worker has little control more common among poorer people, less educated individuals, and members of racial minorities induce high levels of stress (Karasek and Theorell 1990; Lantz, House, Mero, and Williams 2005). All these stressors appear to be more common in the Black Belt.
This study provides a solid baseline and rationale for future Black Belt mortality research augmenting past studies with evidence that the Black Belt's conditions cost lives as well as dollars and documents the region's mortality problems. But what are the solutions? Scholars studying the Black Belt have advocated federal programs along the lines of the 1960s War on Poverty, with region-specific policies to alleviate the Black Belt's distinctive structured inequalities (Allen-Smith, Wimberley, and Morris 2000). Such programs promise to mitigate the Black Belt's excessive mortality, as they likely did in the late 1960s and 1970s before the siege on the welfare state (Krieger et al. 2008). Black-Belt-tailored federal health and antipoverty programs will not come easily, and by themselves will not set all the Black Belt's mortality and socioeconomic inequities right, but they would be a major move in the right direction.
Footnote
* I thank Jill Kiecolt, Rachel Parker-Gwin, John White, M.D., Cynthia Wimberley, and Ronald Wimberley for their helpful comments on this project, and Elizabeth Hoeffel, Tugrul Keskin, and Virginia Rothwell for their invaluable research assistance. Data are from the Interuniversity Consortium for Political and Social Research, which bears no responsibility for my analysis or conclusions.
References
Allen-Smith, Joyce E., Ronald C. Wimberley, and Libby V. Morris. 2000. "America's Forgotten People and Places: Ending the Legacy of Poverty in the Rural South." Journal of Agricultural and Applied Economics 32:319-329.
Billings, Dwight B. 1988. "The Rural South in Crisis: A Historical Perspective." Pp. 13-29 in The Rural South in Crisis, edited by L. J. Beaulieu. Boulder, CO: Westview.
Bolen, Julie C., Luann Rhodes, Eve E. Powell-Griner, Shayne D. Bland, and Deborah Holtzman. 2000. "State-specific Prevalence of Selected Health Behaviors, by Race and Ethnicity Behavioral Risk Factor Surveillance System, 1997." Morbidity and Mortality WeeklyReport 49.
Ciaramitaro, Bridget, Stanley Hyland, James Kovarik, and Michael Timberlake. 1988. "The Development of Underdevelopment in the Mid-South: Big Farmers and the Persistence of Rural Poverty." Humanity and Society 12:347-365.
Cohen, Philip N. 2001. "Race, Class, and Labor Markets: The White Working Class and Racial Composition of U.S. Metropolitan Areas." Social Science Research 30:146-169.
Davis, Jeff. 2000. "Social Stress and Mental Health in the Southern Black Belt." Sociological Spectrum 20:465-494.
Du Bois, W. E. B. 1903. The Souls of Black Folk. Chicago: A.C. McClurg.
Falk, William W., Clarence R. Talley, and Bruce H. Rankin. 1993. "Life in the Forgotten South: The Black Belt." Pp. 53-75 in Forgotten Places: Uneven Development in Rural America, edited by T. A. Lyson and W. W. Falk. Lawrence, KS: University Press of Kansas.
Geronimus, Arline T., John Bound, Timothy A. Waidmann, Cynthia G. Colen, and Dianne Steffick. 2001. "Inequality in Life Expectancy, Functional Status, and Active Life Expectancy across Selected Black and White Populations in the United States." Demography 38:227-251.
Harrison, Bennett and Barry Bluestone. 1990. The Great U-Turn. New York: Basic Books.
Howard, George, Ron Prineas, Claudia Moy, Mary Cushman, Martha Kellum, Ella Temple, Andra Graham, and Virginia Howard. 2006. "Racial and Geographic Differences in Awareness: The Reasons for Geographic and Racial Differences in Stroke Study." Stroke 37:1171-1178.
Karasek, Robert and Töres Theorell. 1990. Healthy Work. New York: Basic Books.
Klomegah, Roger Yao. 2008. "Predictive Factors of Disparities in Childhood Immunization Services: Some Evidence from Southern States." Sociation Today 6.
Krieger, Nancy, David H. Rehkopf, Jarvis T. Chen, Pamela D. Waterman, Enrico Marcelli, and Malinda Kennedy. 2008. "The Fall and Rise of US Inequities in Premature Mortality: 1960-2002." PLoS Medicine 5:227-241.
Krieger, Nancy, Kevin Smith, Deepa Naishadham, Cathy Hartman, and Elizabeth M. Barbeau. 2005. "Experiences of Discrimination: Validity and Reliability of a Self-Report Measure for Population Health Research on Racism and Health." Social Science and Medicine 61:1576-1596.
Lantz, Paula M., James S. House, Richard P. Mero, and David R. Williams. 2005. "Stress, Life Events, and Socioeconomic Disparities in Health: Results from the Americans' Changing Lives Study." Journal of Health and Social Behavior 46:274-288.
Lower Mississippi Delta Nutrition Intervention Research Consortium. 2004. "Self-Reported Health of Residents of the Mississippi Delta." Journal of Health Care for the Poor and Underserved 15:645-662.
Lu, Ning, Michael E. Samuels, and Richard Wilson. 2004. "Socioeconomic Differences in Health: How Much do Health Behaviors and Health Insurance Coverage Account for?" Journal of Health Care for the Poor and Underserved 15:618-630.
Mathews, T. J. and Marian F. MacDorman. 2008. "Infant Mortality Statistics from the 2005 Period Linked Birth/Infant Death Data Set." National Vital Statistics Report 57.
McLaughlin, Diane K. and C. Shannon Stokes. 2002. "Income Inequality and Mortality in US Counties: Does Minority Racial Concentration Matter?" American Journal of Public Health 92:99-104.
McLaughlin, Diane K., C. Shannon Stokes, and Atsuko Nonoyama. 2001. "Residence and Income Inequality: Effects on Mortality among U.S. Counties." Rural Sociology 66:579-598.
Meara, E. R., S. Richards, and D. M. Cutiew. 2008. "The Gap Gets Bigger: Changes in Mortality and Life Expectancy, by Education, 1981-2000." Health Affairs 27:350-360.
Mishel, Lawrence, Jared Bernstein, and Sylvia Allegretto. 2007. The State of Working America 2006/2007. Ithaca, NY: ILR Press.
Morris, Libby V. and Ronald C. Wimberley. 2002. "Health Conditions in the Black Belt South." Annual meeting of the Southern Sociological Society, Baltimore.
Murray, Christopher J. L., Sandeep C. Kulkarni, Catherine Michaud, Niels Tomijima, Maria T. Bulzacchelli, Terrell J. Iandiorio, and Majid Ezzati. 2006. "Eight Americas: Investigating Mortality Disparities across Races, Counties, and Race-Counties in the United States." PLoS Medicine 3.
Namboodiri, Krishnan and C. M. Suchindran. 1987. Life Table Techniques and their Applications. Orlando: Academic.
NCHS. 1983. "Advance Report of Final Mortality Statistics, 1980." Monthly Vital Statistics Report 32.
. 1985. "Mortality Detail Files, Volume II, 1979-1980 [MRDF]." Hyattsville, Maryland: National Center for Health Statistics, U.S. Department of Health and Human Services [producer]. Ann Arbor: Inter-university Consortium for Political and Social Research [distributor].
. 1991. "Natality Local Area Summary Data, 1980 [MRDF]." Hyattsville, Maryland: National Center for Health Statistics, U.S. Department of Health and Human Services [producer]. Ann Arbor: Inter-university Consortium for Political and Social Research [distributor].
Oliver, M. Norman and Carles Muntaner. 2005. "Researching Health Inequities among African Americans: The Imperative to Understand Social Class." International Journal of Health Services 35:485-498.
Raphael, Dennis. 2006. "Social Determinants of Health: Present Status, Unanswered Questions, and Future Directions." International Journal of Health Services 36:651-677.
Reich, Michael. 1981. Racial Inequality. Princeton: Princeton University Press.
Shryock, Henry S. and Jacob S. Siegel. 1976. The Methods and Materials of Demography. San Diego: Academic.
Smith, Shannon L., Sara A. Quandt, Thomas A. Arcury, Lindsay K. Wetmore, Ronny A. Bell, and Mara Z. Vitolins. 2006. "Aging and Eating in the Rural, Southern United States: Beliefs about Salt and Its Effect on Health." Social Science and Medicine 62:189-198.
Sudano, Joseph J. and David W. Baker. 2006. "Explaining US Racial/Ethnic Disparities in Health Declines and Mortality in Late Middle Age: The Roles of Socioeconomic Status, Health Behaviors, and Health Insurance." Social Science and Medicine 62:909-922.
Tomaskovic-Devey, Donald and Vincent J. Roscigno. 1996. "Racial Economic Subordination and White Gain in the U.S. South." American Sociological Review 61:565-589.
U.S. Census Bureau. 1982. Statistical Abstract of the United States 1982-83. Washington: U.S. Government Printing Office.
. 1990. "County Population Estimates (Experimental) by Age, Sex, and Race: 1980-1985 [MRDF]." Washington: Bureau of the Census [producer]. Ann Arbor: Inter-university Consortium for Political and Social Research [distributor].
. 1992. Statistical Abstract of the United States 1992. Washington: U.S. Government Printing Office.
United Health Foundation. 2007. "America's Health Rankings." Minnetonka, MN.
Whayne, Jeannie M. 1996. A New Plantation South. Charlottesville: University Press of Virginia.
Wimberley, Dale W., Alton Thompson, and Ronald C. Wimberley. 2007. "The Persistence of Institutional Discrimination: Black Farmers versus the U.S. Department of Agriculture." Annual meeting of the Southern Sociological Society, Atlanta.
Wimberley, Ronald C. 2008. "Sociology with a Southern Face: Why Are We Sociologists and What Are We Doing about It in the South?" Social Forces 86:881-909.
Wimberley, Ronald C. and Libby V. Morris. 1996. The Reference Book on Regional Well-Being. Mississippi State, MS: Southern Rural Development Center.
. 2002. "The Regionalization of
Poverty: Assistance for the Black Belt South?" Southern Rural Sociology
18:294-306.
Return to Sociation Today
Fall 2008
Table 2 corrected April 20, 2009
©2008 by the North Carolina Sociological Association