Sociation Today®
The Official
Journal
of
The North
Carolina
Sociological
Association: A
Refereed Web-Based
Publication
ISSN 1542-6300
Editorial Board:
Editor:
George H. Conklin
 North Carolina
 Central University

Board:
Richard Dixon,
 UNC-Wilmington

Chien Ju Huang,
 North Carolina
 Central University

Ken Land,
 Duke University

Miles Simpson,
 North Carolin
 Central University

Ron Wimberley,
 N.C. State University

Robert Wortham,
 North Carolina
 Central University
 ®
®
Volume 2, Number 2
Fall 2004
Social Stratification:
The Digital Divide In North Carolina
by
Kenneth R. Wilson, Christa Reiser, Kelly Potter
East Carolina University
and
Jennifer S. Wallin
RTI International
Introduction
The Internet may be the fastest growing technology in human history (Lebo 2000). This “digital infrastructure” is connecting and changing our society. In the process, many aspects of American society, from the way we educate our children, to how we interact with elected officials, to how we meet the people we date and marry, are being transformed (Bucy, 2000; Lauman, 2000; Attewell, 2001; Seccombe and Warner, 2004). The Internet has also changed the way we shop, find employment, pay taxes, use the library and even earn college degrees (Bertot & McClure, 1998; Bimber, 1999; Brodie et al., 2000; DiMaggio et al., 2001; Katz et al., 2001).
The ability to access and use this technology effectively will be the key to economic success for both individuals and communities. This new technology is being incorporated into the public school curriculum and is transforming the way information is being created and distributed. Communities that wish to keep or recruit new high paying jobs need to provide businesses with high-speed access. Individuals must learn to use this new technology in order to have any chance of being successful in the emerging knowledge economy (DiMaggio, et al., 2001; Vision 2030, 2000; Green, 2002). While some celebrate the arrival of computers and the Internet, it is clear that all people do not have equal access to this new technology.
The “digital divide” is a concept developed to describe the gap between those who are reaping the advantages of this new technology and those who are not. Among others, rural residence, race, and gender have been linked to the digital divide (Wilson, et al, 2003; Bimber, 2000; Green, 2002). Recent studies show that the size of the divide has been shrinking for many groups (NIAA, 2002; Haythornthwaite, 2001). This paper explores how the gaps in access to information technology are associated with various aspects of social stratification in North Carolina and examines whether or not these social and economic divides have been shrinking during the last 5 years.
In October 1993, the U.S. Department of Commerce adopted the goal of providing universal telecommunication and Internet access (NTIA, 1993). In 1997, the President declared a goal of wiring every home by the year 2007 (NTIA, 1998). North Carolina has recognized the need for universal Internet access to spread the benefits of economic development and increase citizen access to state government (Vision 2030, 2000; Rural Prosperity Taskforce, 2000). Most North Carolina counties have public Internet access available in libraries or local community colleges. These facilities may provide an alternative to home Internet access (Lentz, et. al., 2000). While there was a national commitment to universal access, some groups were falling through the cracks (Schement, 1998; Attewell, 2001).
Computer and Internet
users are divided along the lines of race. White households are
far more likely to have home computers and home Internet access than
Black or Hispanic households (NTIA 1995, 1998, 1999, 2000; Attewell,
2001). NTIA (1998) reported that in 1997 White households were
still more than twice as likely (40.8%) to own a computer than Black
(19.3%) or Hispanic (19.4%) households. This relationship held
across all income levels. The NTIA (1998) also reported that home
Internet access was 3 times higher for White households than for Black
or Hispanic households. During the late 1990’s, all groups experienced
tremendous increases in home computer ownership and home Internet
access. While White households (55.7%) were still more likely
than Black (32.6%) or Hispanic (33.7%) households to own computers, the
size of the gap has not increased since 1998. However, according
to U.S. Department of Commerce figures (2000), from 1994 to 2000, the
technology gap between Blacks and Whites increased.
In regard to home
Internet access, White households (46.1%) were still more likely than
Black (23.5%) or Hispanic (23.6%) households to have home Internet
access and the size of these gaps continued to grow (NTIA,
2000). The most recent research documented continued growth
in computer and Internet usage for all racial groups. In 2001,
White Americans were still more likely to use a computer or the
Internet than Black or Hispanic Americans but the proportion of Black
and Hispanic computer and Internet users was growing at a more rapid
rate than the proportion of White users (NTIA, 2002).
In addition to race, geographic location plays a major part in determining who owns a home computer and who has home access
to the Internet (Lentz and Oden, 2001; NTIA, 2000; Rural Prosperity
Task Force, 2000). While the size of the difference between urban
and rural areas in home computers seems to have stabilized, in most
areas of information technology the gap between urban and rural areas
is growing. Urban residents are far more likely to have access to
computer services than their rural counterparts (e.g., DSL, cable
modems, and digital television). This makes it more difficult for rural
businesses to compete against businesses located in urban areas and
prevents rural residents from benefiting from economic opportunities
that urban areas have taken for granted (Drabenstott, 2001; Hindman,
2000; Lentz and Oden, 2001;Parker, 2000; Strover, 1999).
Even among college students who have free Internet access on campus,
students from families living in rural areas accessed the Internet less
than students from urban areas. While these rural students
clearly recognized the importance of the Internet to the future of
their communities, they had less time to use it because they were more
likely to commute to the university than the urban students (Crews and
Feinberg, 2002).
Many studies have
documented gender differences in computer and Internet usage (Bimber,
2000; DiMaggio et al., 2001; NIAA 2000; Jackson, 2001; Volman and van
Eck, 2001). Some researchers trace this gender gap to the idea
that computers and the Internet (as well as technology in general) are
“gendered” (Green, 2002). This is reflected in cultural
stereotypes that indicate that computers and the Internet are more
appropriate activities for men than for women (Reinen and Plomp, 1997;
Fletcher-Flinn and Suddendorf, 1996). Male values may also be
embedded in the design of advanced technology so that it becomes
associated with a masculine identity. And when women decide to
use computers and the Internet, they may find that the available
software and web sites don’t reflect their needs or
interests. Some of the differences between men and
women in their Internet use and access can be explained by various
socio-economic factors (Bimber, 2000).
While there has been a
gap between men and women in their computer and Internet usage, between
1998 and 2001 women raised their Internet use and closed this
gap. Katz et.al. (2001) using cohort data from national
representative telephone surveys from 1992 to 2000), show that new
Internet users are proportionally more likely to be female than is
found in surveys that look at usage status in any given year. In
2001, 53.9% of men and 53.8% of women reported using the Internet
(NTIA, 2002). However, though both women and men seem to be
equally likely to use the Internet, once online, “Women remain less
frequent and less intense users of the Internet” (Ono, 2003: 112).
Income is a major
determinant of whether an individual can afford to buy a home computer
or pay for home Internet access (Lipke, 2000; NIAA 2000, 2002;
Warschauer, 2003). Computer ownership is more widespread for
those with high incomes. According to the Benton Foundation, by
late 2001, 80% of those with annual household incomes of $75,000 or
more used a computer, compared with only 25% of the poorest American
families (Warschauer, 2003). Lower levels of household income tend to
be associated with the three social divides that are the focus of this
study. Since computers and Internet access are expensive, the new
digital disadvantages may simply reflect the lower level of economic
resources available to rural, female and minority households.
Education can prepare
people to learn the new skills and procedures required to enter the new
technological world. Americans with a college education are
almost six times as likely to have a home computer (75.7 percent
compared with 12.8 percent) or home Internet access (69.9 percent vs.
11.7 percent) as those with an elementary-school education (NOAA,
2000). NTIA estimates that income and education together account
for half of the racial differences in Internet access (NTIA, 2000).
A number of other
variables influence the level of digital inclusion in the year
2000. Young (18 to 24) adults had Internet usage rates very
similar to adults between 25 and 49 (56.8% vs. 55.4%). Only 29.6%
of older adults reported using the Internet (NTIA, 2000). Two
parent households are much more likely to have home Internet access
than single-parent households (60.6% vs. 35.7% male-headed and 30.0%
female-headed) (NTIA, 2000). Home computer and Internet access
may also augment a child's leaning experience in school (Lauman,
2000).
Since 1999, three
citizen surveys have documented the level of home computer ownership
and Internet access in North Carolina.
STUDY 1: In 1999, the North
Carolina Board of Science and Technology included a set of questions
concerning computer and Internet usage in a more general study of
public perceptions of the role and importance of science and technology
in the North Carolina economy. A general population telephone
survey employed random digit dialing. A total of 522 respondents
completed the interview. The complete report is available on the E-NC
website.
STUDY 2: After viewing the
results of the 1999 survey, many local decision makers wanted to see
the results for their counties. Unfortunately, the sample size
(N=500) made it impossible to provide reliable information at the
county level. In 2001, the Rural Internet Access Authority
planned to extend the work started by Vision 2030 and to make it more
relevant to local decision makers in every part of North Carolina. RIAA
wanted results that could provide useful and valid information to the
local decision makers in every NC County. In order to facilitate
planning for improved Internet access in all 100 North Carolina
Counties, independent random samples were drawn from each North
Carolina County. A sample of 12,904 interviews with North
Carolinians was completed in June 2002.
STUDY 3: The third study continues to track computer and
Internet use in North Carolina. Interviewing began on Jan. 14, 2004 and
was completed on Feb. 11, 2004. A total of 20 interviewers were chosen,
trained and worked on the project. There were 1197 completed
interviews. Quotas were used to insure that there was an adequate
representation of rural counties. The sample of telephone numbers
was purchased from Survey Sampling, Inc. A significant number of
interviews were conducted in Spanish using a bi-lingual
interviewer. Upon encountering a language barrier with a Hispanic
respondent, a notation was made of the telephone number and was put
aside for re-contact. This is important to remember when the
results for Hispanic respondents are compared to other studies that
only interview English-speaking Hispanics.
Changing
Levels of Home Computer Ownership
Home Computer ownership
is a basic port of entry into the new economy. Over the past five
years, the level of home computer ownership has been steadily
increasing. Table 1 presents the results of the three surveys in
a format for easy comparison. Table 1 shows that home computer
ownership in North Carolina has increased from 53% in 1999 to 67% in
2004. During this 5-year period, the rate of home computer
ownership increased 26% in North Carolina.
|
Table 1: Home Computer
Penetration |
|||
|
Percentage
of |
|||
|
Have A Home
Computer |
|||
|
|
|
|
|
|
|
1999 |
2002 |
2004 |
|
Overall |
53% |
60% |
67% |
|
Gender |
|
|
|
|
Men |
59% |
65% |
68% |
|
Women |
53% |
57% |
63% |
|
Generations |
|
|
|
|
Gen Y (ages
18 -27) |
55% |
68% |
76% |
|
Gen X (ages
28-39) |
60% |
71% |
79% |
|
Training
Boomers (ages 40-49) |
60% |
72% |
70% |
|
Leading
Boomers(ages 50-58) |
66% |
58% |
73% |
|
Matures
(ages 59-68) |
44% |
43% |
50% |
|
After work
(age 69+) |
24% |
28% |
35% |
|
Race and
ethnicity |
|
|
|
|
Whites |
61% |
65% |
68% |
|
Blacks |
31% |
44% |
63% |
|
Native
American |
|
50% |
39% |
|
Hispanic |
|
37% |
31% |
|
Other |
|
65% |
74% |
|
|
|
|
|
|
Urban |
58% |
64% |
71% |
|
Rural |
46% |
55% |
59% |
|
Household
Income |
|
|
|
|
Less than
$15,000 |
35% |
34% |
31% |
|
$15,000 to
$24,999 |
25% |
43% |
43% |
|
$25,000 to
$29,999 |
37% |
60% |
64% |
|
$30,000 to
$49,999 |
43% |
71% |
78% |
|
$50,000 to
$74,999 |
49% |
79% |
88% |
|
$75,000 to
$99,999 |
50% |
86% |
92% |
|
$100,000
and above |
66% |
91% |
97% |
|
Educational
Attainment |
|
|
|
|
Less than
High School |
20% |
33% |
36% |
|
High School
Graduates |
47% |
60% |
65% |
|
Community
College Degree |
65% |
75% |
78% |
|
College
Degree |
76% |
84% |
87% |
|
Graduate
Degree |
78% |
87% |
93% |
|
Children
Living at Home |
|
|
|
|
No |
49% |
54% |
55% |
|
Yes |
64% |
69% |
81% |
When examining Table 1, be sure to notice:
- Home computer ownership has continued to rise.
- In 1999, the leading baby boomers were the most likely
to own a computer but that has changed. Both Gen X and Gen Y have
increased their computer ownership so rapidly that they have overtaken
the Leading Boomers. The elderly are least likely to own a home
computer.
- While white households have increased their home
computers, African American households have increased even
faster. In 1999 the African American rate was about half the
White rate, but it increased to over 90% the White rate in 2004.
- Home computers increased faster in urban counties than
in rural counties.
- Almost every home with an income of over $100,000 per
year has a home computer but less than one-third of the poverty
households have a home computer. The rate of home computer
ownership has decreased among North Carolina families making less than
$15,000 a year.
- The greatest increase in home computers occurred in households with children (69% to 81%). Almost no change was observed in households without children (54% to 55%).
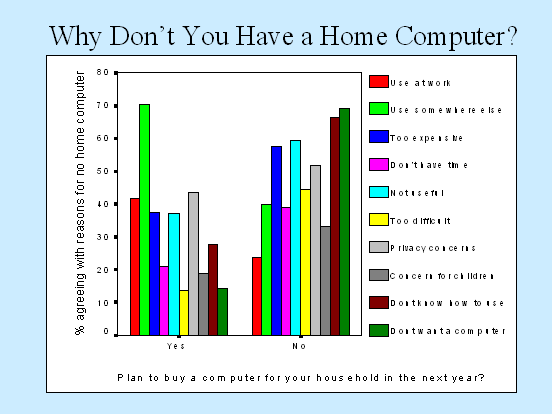
People who reported that their household did
not have a home computer were asked if they were planning to buy a home
computer within the next year. They were also asked a series of
questions to identify the reason they did not have a home
computer. The results are presented in the following graph.
Note that the reasons for not having a home computer given by folks who
were planning to buy a computer in the next year are presented on the
left side of the graph while those given by the folks who were not
planning to buy a home computer are on the right side. For the
folks planning to buy a computer, their primary reason for not having a
home computer is that they can use one somewhere else (the light green
bar on the graph). For people who are not planning to buy a
computer, the four reasons (Don’t want one; don’t know how to use a
computer; not very useful and too expensive) suggest these people don’t
know how to use a computer and that a computer is too expensive.
There are two ways of looking at
Internet access. Both approaches are important but they produce
very different numbers so it is important to be careful when reading
the following tables. Many people are interested in the
proportion of ALL households that have home Internet access. In
these households, people can do private research and children can do
their homework with their parents’ help. Today about 59% of all
NC households have home Internet access.
At the beginning of this century, many NC households
could not get home Internet access. That barrier has been
eliminated and today every NC household can get home Internet access
with a local telephone call. The biggest remaining barrier to
home Internet access is that it requires a home computer. The
second proportion is the proportion of households with home computers
that have home Internet access. This proportion indicates the extent of
the barriers remaining after a home computer has been purchased.
Today about 89% of the homes with computers have Internet access.
In the four and a half years between these
studies, the proportion of homes with Internet access has increased
from 36 to 59 percent. Today a majority of North Carolina
households have home Internet access. While it is far from
universal, in five years it has become a common part of our everyday
lives.
|
Table
2: Home Internet Penetration |
|||
|
Percentage
of ALL NC Households |
|||
|
That
Have Home Internet Access |
|||
|
|
|
|
|
|
|
1999 |
2002 |
2004 |
|
Overall |
36% |
52% |
59% |
|
Gender |
|
|
|
|
Men |
41% |
58% |
61% |
|
Women |
35% |
49% |
55% |
|
Generations |
|
|
|
|
Gen Y (ages 18 -27) |
40% |
59% |
65% |
|
Gen X (ages 28-39) |
40% |
63% |
72% |
|
Training Boomers (ages
40-49) |
42% |
64% |
67% |
|
Leading Boomers(ages
50-58) |
49% |
50% |
65% |
|
Matures (ages 59-68) |
23% |
34% |
43% |
|
After work (age 69+) |
12% |
24% |
29% |
|
Race and ethnicity |
|
|
|
|
Whites |
43% |
57% |
62% |
|
Blacks |
19% |
34% |
49% |
|
Native American |
|
37% |
38% |
|
Hispanic |
|
35% |
22% |
|
Other |
|
57% |
67% |
|
|
|
|
|
|
Urban |
43% |
57% |
62% |
|
Rural |
26% |
46% |
51% |
|
Household Income |
|
|
|
|
Less than $15,000 |
9% |
25% |
25% |
|
$15,000 to $24,999 |
4% |
33% |
32% |
|
$25,000 to $29,999 |
27% |
52% |
55% |
|
$30,000 to $49,999 |
23% |
62% |
68% |
|
$50,000 to $74,999 |
34% |
73% |
83% |
|
$75,000 to $99,999 |
31% |
81% |
87% |
|
$100,000 and above |
43% |
85% |
94% |
|
Educational Attainment |
|
|
|
|
Less than High School |
2% |
26% |
28% |
|
High School Graduates |
30% |
51% |
57% |
|
Community College Degree |
45% |
65% |
69% |
|
College Degree |
58% |
78% |
83% |
|
Graduate Degree |
64% |
83% |
88% |
|
Children Living at Home |
|
|
|
|
Yes |
43% |
61% |
74% |
|
No |
34% |
46% |
48% |
- While home Internet access is increasingly common for both males and females, males are still more likely to report it.
- While home Internet access was most common among the leading edge of the baby boom, it has become more common among younger citizens.
- While home Internet access is most common among Whites and Others (Asian, mixed, etc.), it is rapidly increasing among African Americans.
- The proportion of Hispanics probably decreased because the 2004 survey included families that did not speak English. In the earlier surveys, only English Speaking Hispanics were included.
- The proportion of homes with Internet access has almost doubled between 1999 and 2002. While the gap between urban and rural counties decreased between 1999 and 2002, it has stabilized since then.
- While better off families continue to increase their home Internet access, the progress made by poorer families has stopped.
- While more educated families have continued to increase their home Internet access, the progress made by less educated households has slowed.
- Families with children continue to increase their home Internet access while the progress made by families without children has slowed.
Respondents who did not have home
Internet access were asked a series of questions to explore why.
The following graphic shows that the most common answers were that they
did need to use the Internet at home and that it was too
expensive.
In the four and a half years between these
studies, the proportion of homes with computers that also have home
Internet access has increased 31 percent from 68% to 89%. While
it has not quite caught up with telephone access (about 95%), Internet
access among homes with a computer is almost as common. This is a
particularly impressive achievement because it includes an increase
from 57% to 91% in rural counties. E-NC should be proud that its
work promoting computer and Internet literacy has paid off in this
unusually strong growth in rural counties.
|
Table
3: Internet Penetration Demographic |
|||
|
Percentage
of Homes |
|||
| That Have Intenet Access |
|||
|
With
Home Computers |
|||
|
|
1999 |
2002 |
2004 |
|
Overall |
68% |
87% |
89% |
|
Gender |
|
|
|
|
Men |
68% |
88% |
90% |
|
Women |
67% |
86% |
89% |
|
Generations |
|
|
|
|
Gen Y (ages 18 -27) |
72% |
87% |
85% |
|
Gen X (ages 28-39) |
69% |
89% |
91% |
|
Training Boomers (ages
40-49) |
70% |
88% |
96% |
|
Leading Boomers(ages
50-58) |
74% |
87% |
89% |
|
Matures (ages 59-68) |
52% |
80% |
84% |
|
After work (age 69+) |
50% |
85% |
81% |
|
Race and ethnicity |
|
|
|
|
Whites |
69% |
88% |
91% |
|
Blacks |
61% |
70% |
78% |
|
Native American |
|
75% |
100% |
|
Hispanic |
|
95% |
74% |
|
Other |
|
89% |
90% |
|
|
|
|
|
|
Urban |
73% |
84% |
89% |
|
Rural |
57% |
88% |
91% |
|
Household Income |
|
|
|
|
Less than $15,000 |
29% |
72% |
82% |
|
$15,000 to $24,999 |
17% |
78% |
76% |
|
$25,000 to $29,999 |
73% |
87% |
87% |
|
$30,000 to $49,999 |
53% |
88% |
87% |
|
$50,000 to $74,999 |
70% |
93% |
94% |
|
$75,000 to $99,999 |
62% |
94% |
95% |
|
$100,000 and above |
64% |
94% |
98% |
|
Educational Attainment |
|
|
|
|
Less than High School |
8% |
79% |
78% |
|
High School Graduates |
64% |
85% |
88% |
|
Community College Degree |
67% |
86% |
89% |
|
College Degree |
76% |
92% |
96% |
|
Graduate Degree |
82% |
95% |
95% |
|
Children Living at Home |
|
|
|
|
Yes |
70% |
88% |
92% |
|
No |
66% |
85% |
87% |
When examining Table 3, be sure to notice:
- There is very little difference between men and women in their interest in connecting a home computer to the Internet.
- The trailing boomers are most likely to connect their home computers to the Internet but even most of the elderly respondents who have a computer get it connected to the Internet.
- The large gap that existed between the urban and rural counties in 1999 has been closed. Part of this may be due to the fact that during that time rural Internet access expanded so that a local phone call could connect every household to the Internet. The work done by e-NC to expand the availability of high speed Internet access to 80% of NC households is a factor closing this gap (e-NC website: http://www.e-nc.org/pdf/hsiaexecsummary.pdf )
- In middle and high-income households, most households with a computer are connected. There has been great progress in lower income families.
- Among respondents who graduated from high school or achieved a higher level of education, most households with a computer are connected. Among high school drop-outs who have a home computer, there has been great progress getting connected to the Internet.
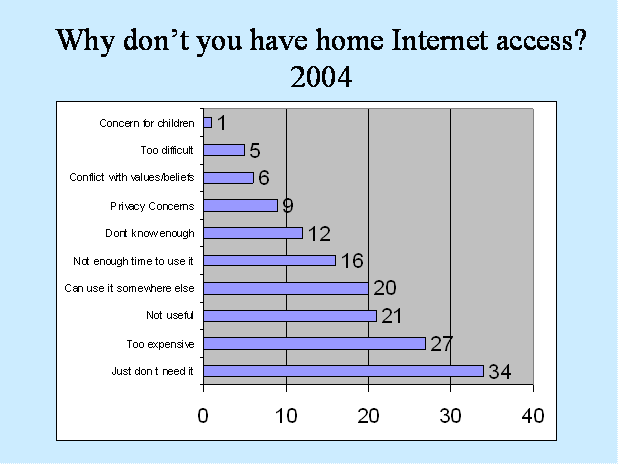
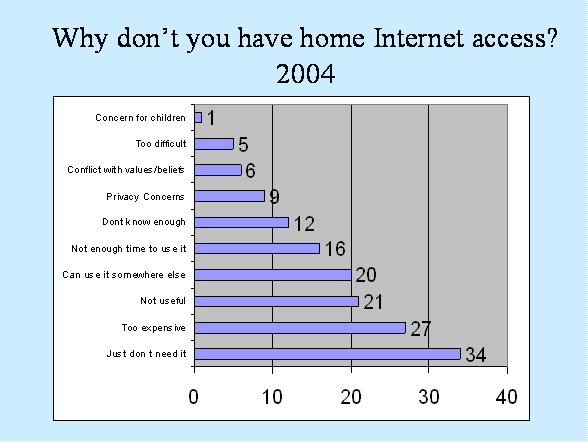
Why Don’t You Have Home Internet Access?
Respondents with home computers who did not have home Internet access were asked a series of questions to discern their reasons. When examining the following graphic remember that people could report more than one reason.
A third of the respondents reported that they just didn’t need home Internet access. Another fourth reported that it was too expensive. The next two most popular reasons were that it was not useful and they could use it somewhere else.
Conclusions
Digital technology creates new opportunities but it can also reinforce old social divisions. Unequal access to the Internet can hamper economic development and undermine the general quality of life in under-served areas. Three surveys conducted between 1999 and 2004 document the progress that has been made. In 1999, only about half (57%) of the rural households with home computers had Internet access. By 2004, this figure had climbed to 91% (almost equal to telephone penetration). In rural North Carolina, one-third of the people who do not have home Internet access use the Internet somewhere else. Between 2002 and 2004, the proportion of North Carolinians who reported using public access facilities increased from 2.7 percent to 10.4 percent. Over half of them (53%) reported that the public access facility was sponsored by e-NC. This is probably a low estimate since some respondents don’t remember the facility’s sponsor. Over 175,000 North Carolina citizens remember using an e-NC facility.
Rural access is only one challenge to universal digital literacy. Another challenge is the speed with which digital technology is developing. When the first questionnaire was being developed in 1999, concern focused on those households that could not obtain dial-up Internet access without paying a long distance charge. There was not a single question on the 1999 survey about high speed Internet access. Less than 5 years later, every household in North Carolina can obtain local dial-up Internet access and over 80% of NC households have high speed Internet access available (e-NC website: http://www.e-nc.org/pdf/hsiaexecsummary.pdf ). Over 40 percent of the households with Internet access have some type of high-speed connection.
As much as the smaller gaps are welcomed, traditional social stratification variables are still clearly associated with the gaps that remain. While “white” and “other” households are most likely to have home computers, African American households have increased faster during this time. Perhaps the most interesting statistic is the fact that almost every home with an income of over $100,000 per year has a home computer but less than one-third of the poverty households have home computers. For the people planning to buy a computer, the primary reason for not already owning one is that they can use a computer somewhere else. For people who are not planning to buy a computer, four reasons (Don’t want one; Don’t know how to use; Not useful; and Too expensive) suggest these people don’t know how to use a computer and that a computer is still too expensive for them. About sixty percent of the people who are not planning to buy a computer cite the cost as one of the factors.
Low-income families face special challenges. Less than a third of families with incomes under $15,000 have a home computer and less than one-fourth have home Internet access. Many of these families make real sacrifices to help their children prepare for the modern world. Almost half of the households making less than $15,000 a year and having a child living at home have a home computer. This is over twice the rate for poor families without children living at home. Almost 75% of the families with children who do not have a computer and who are not planning on buying a computer cite the cost of the computer as a reason for not having a computer.
References
Attewell, Paul. 2001. “The First and Second Digital Divides.” Sociology of Education 74: 252-259.
Bertot, J.C. and C.R. McClure. 1998. The 1998 National Survey of U.S. Public Library Outlet Internet Connectivity: Final Report. American Library Association Revised Feb. 1999. http://www.ala.org/cfapps/archive.cfm?path=oitp/digitaldivide/survey.html
Bimber, Bruce. 1999. “The Internet and Citizen Communication with Government: Does the Medium Matter?” Political Communication 16:409-429.
Bimber, Bruce. 2000. “Measuring the Gender Gap on the Internet.” Social Science Quarterly
Bucy, Erik P. 2000. “Social Access to the Internet.” Harvard International Journal of Press-Politics 5:50-61.
Brodie, Mollyann, Rebecca E. Flournoy, Drew E. Altman, John M. Benson and Marcus Rosenbaum. 2000. “Health Information, the Internet, and the Digital Divide.” Health Affairs 19:255-265.
Crews, M. and M. Feinberg. 2002. “Perceptions of University Students Regarding the Digital Divide”
Social Science Computer Review 20, no. 2:116-123
Drabenstott, Mark. 2001. “New Policies For A New Rural America.” International Regional Science Review 24: 3-15.
DiMaggio, Paul, Eszter Hargittai, W. Russell Neuman and John P. Robinson. 2001. “Social Implications of the Internet” Annual Review of Sociology 27:307-336.
Fletcher-Flinn, Claire M. and Thomas Suddendorf. 1996. “Computer Attitudes, Gender and Exploratory Behavior: A Developmental Study.” Journal of Educational Computing Research
Haythornthwaite, Caroline. 2001. “Introduction: The Internet in Everyday Life” American Behavioral Scientists, 45:363-382.
Hindman, Douglas B. 2000. “The Rural-Urban Digital Divide.” Journalism and Mass Communication Quarterly 77:549-560.
Katz, James E., Ronald E. Rice and Philip Aspden. 2001. “The Internet, 1995-200: Access, Civic Involvement and Social Interaction.” American Behavioral Scientist 45:405-419.
Lentz, Becky, Joseph Straubhaar, Antonio LaPastina, Stan Main and Julie Taylor. 2000. “Structuring Access: The Role of Public Access Centers in the “Digital Divide” presented at the International Communication Association meetings in Acapulco. http://www.utexas.edu/research/tipi/]
Lentz, R.G., Michael D. Oden. 2001. “Digital divide or digital opportunity in the Mississippi Delta region of the US.” Telecommunications Policy 25:291-313.
Lipke, D.J. (2000) “Dead End Ahead?” American Demographics 22:10-12.
Lauman, Daylene. 2000. “Student Home Computer Use: A Review of the Literature.” Journal of Research on Computing in Education 33:196-203.
NTIA (National Telecommunications and Information Administration). 1993. National Information Infrastructure: Agenda for Action. http://metalab.unc.edu/nii/toc.html
NTIA (National Telecommunications and Information Administration). 1995a. Connecting The Nation: Classrooms, Libraries, and Health Care Organizations in the Information Age. http://www.ntia.doc.gov/connect.html
NTIA (National Telecommunications and Information Administration). 1995b. Falling through the Net: A Survey of Have Nots in Rural and Urban America. http://www.ntia.doc.gov/ntiahome/digitaldivide/
NTIA (National Telecommunications and Information Administration). 1998. Falling through the Net II: New Data on the Digital Divide. http://www.ntia.doc.gov/ntiahome/net2/
NTIA (National Telecommunications and Information Administration). 1999. Falling through the Net: Defining the Digital Divide. http://www.ntia.doc.gov/ntiahome/digitaldivide/
NTIA (National Telecommunications and Information Administration). 2000. Falling through the Net: Toward Digital Inclusion. http://www.ntia.doc.gov/ntiahome/digitaldivide/
NTIA (National Telecommunications and Information Administration). 2002. A Nation Online: How Americans Are Expanding Their Use of the Internet. http://www.ntia.doc.gov/ntiahome/dn/index.html
Parker, Edwin B. 2000. “Closing the Digital Divide in Rural America” Telecommunications Policy 24:281-290.
Rainie, Lee and Dan Packel. 2001. “More Online, Doing More: 16 million newcomers gain Internet access in the last half of 2000 as women, minorities, and families with modest incomes continue to surge online” The Pew Internet & American Life Project. http://www.pewinternet.org/PPF/r/30/report display.asp
Reinen, Ingeborg Janssen and Tjeerd Plomp. 1997 “Information Technology and Gender Equality: A Contradiction in Terminis? Computers & Education 28:65-78.
Rural Prosperity Task Force 2000 Rural Prosperity Task Force Final Report. Link no longer available.
81:868-876. 15(4): 369-92 24:281-290.
Schement, Jorge R. (1998). The Persistent Gap in Telecommunications: Toward Hypotheses and Answers. http://iip.ist.psu.edu/Publication/Schement/The%20Persistent%20Gap.pdf
Strover, Sharon. 1999. “Rural Internet Connectivity” presented at the Telecommunications Research and Policy Conference. http://www.utexas.edu/research/tipi/
Stewart, T.A. (1999). “A Nation of Net Have Nots? No.” Fortune 1:184-188.
Vision 2030 (2000) Vision 2030: Mapping the Future. North Carolina Board of Science and Technology. http://govhunt.gov.state.nc.us/govoffice/vision2030/perceptions.doc
Wilson, Kenneth R., Jennifer Wallin and Christa Reiser. 2003 “Social Stratification and the Digital Divide” Social Science Computer Review 21:133-143.
Notes:
The North Carolina Vision 2030 Project and the North Carolina Board of Science and Technology funded the 1999 survey and e-NC funded the 2001 and 2004 surveys. The authors would like to thank Jane Patterson and Deborah Watts for their support and insights in developing this project and for their concern with the people of eastern North Carolina.
Kenneth Wilson, Associate Professor of Sociology, earned a Ph.D. from Purdue University. In 1989 he founded the ECU Survey Research Laboratory and directed over 100 surveys for grants and contracts valued over 1 million dollars before stepping down in May 2001. He can be contacted at wilsonk@mail.ecu.edu
Christa Reiser earned her Ph.D. at North Carolina State University while teaching sociology at East Carolina. She is currently the Co-Director of the ECU Women Studies Program. Her areas of interest are the Sociology of the Family, Gender Studies and the Sociology of Emotions. In March 2001, her research monograph, Reflections on Anger : Women and Men in a Changing Society, was published in paperback by Praeger Publishing.
Kelly Potter is a library assistant for Joyner Library at East Carolina University, and will finish her MA in Sociology at ECU in the fall of 2004.
Jennifer Wallin completed her MA degree in Sociology at East Carolina University in May 2002. She is currently a Survey Specialist for RTI International.
Return to Sociation Today, Fall 2004
©2004 by the North Carolina Sociological Association